Annual Car Production in the United States
1910–1925 A student is using the table as part of a social studies class presentation on the US auto industry in the early twentieth century. The student notes that, according to the table, from 1910 to 1925 _______
Which choice most effectively uses data from the
table to complete the statement?
Choice A is the best answer because it most effectively uses data from the table
to complete the statement about the US auto industry in the early twentieth
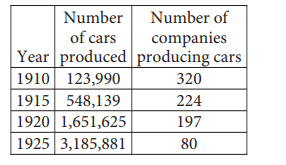
century. The table shows the number of cars produced annually and number
of companies producing cars in the United States between 1910 and 1925 in
increments of five years. According to the table, the number of cars produced
consistently increased from one increment to the next, going from 123,990 cars
in 1910 to 3,185,881 cars in 1925. At the same time, the table shows that the
number of companies producing cars consistently decreased, going from 320
companies in 1910 to only 80 companies in 1925. Thus, the table shows that the
number of cars produced increased from 1910 to 1925, even as the number of
companies producing cars decreased.
Choice B is incorrect. The table shows that the number of cars produced in the US
increased, going from 123,990 in 1910 to 3,185,881 in 1925, instead of remaining
unchanged, and the table also shows that the number of companies producing
cars decreased from 320 to 80 instead of remaining unchanged. Choice C
is incorrect because the table indicates that the number of cars produced
consistently increased from 1910 to 1925, going from 123,990 cars to 3,185,881
cars, instead of decreasing; moreover, the table shows that the number of
companies producing cars from 1910 to 1925 declined from 320 to 80 instead of
remaining unchanged. Choice D is incorrect because the table indicates that the
number of companies producing cars consistently decreased from 1910 to 1925,
going from 320 companies to only 80 companies.
Choice A is the best answer because it most effectively uses data from the table
to complete the statement about the US auto industry in the early twentieth
century. The table shows the number of cars produced annually and number
of companies producing cars in the United States between 1910 and 1925 in
increments of five years. According to the table, the number of cars produced
consistently increased from one increment to the next, going from 123,990 cars
in 1910 to 3,185,881 cars in 1925. At the same time, the table shows that the
number of companies producing cars consistently decreased, going from 320
companies in 1910 to only 80 companies in 1925. Thus, the table shows that the
number of cars produced increased from 1910 to 1925, even as the number of
companies producing cars decreased.
Choice B is incorrect. The table shows that the number of cars produced in the US
increased, going from 123,990 in 1910 to 3,185,881 in 1925, instead of remaining
unchanged, and the table also shows that the number of companies producing
cars decreased from 320 to 80 instead of remaining unchanged. Choice C
is incorrect because the table indicates that the number of cars produced
consistently increased from 1910 to 1925, going from 123,990 cars to 3,185,881
cars, instead of decreasing; moreover, the table shows that the number of
companies producing cars from 1910 to 1925 declined from 320 to 80 instead of
remaining unchanged. Choice D is incorrect because the table indicates that the
number of companies producing cars consistently decreased from 1910 to 1925,
going from 320 companies to only 80 companies.